Office document capacity planning: sessions, conversions, and save traffic
Distinguish open sessions, requests, conversions, and save traffic so capacity estimates reflect the real document workload.
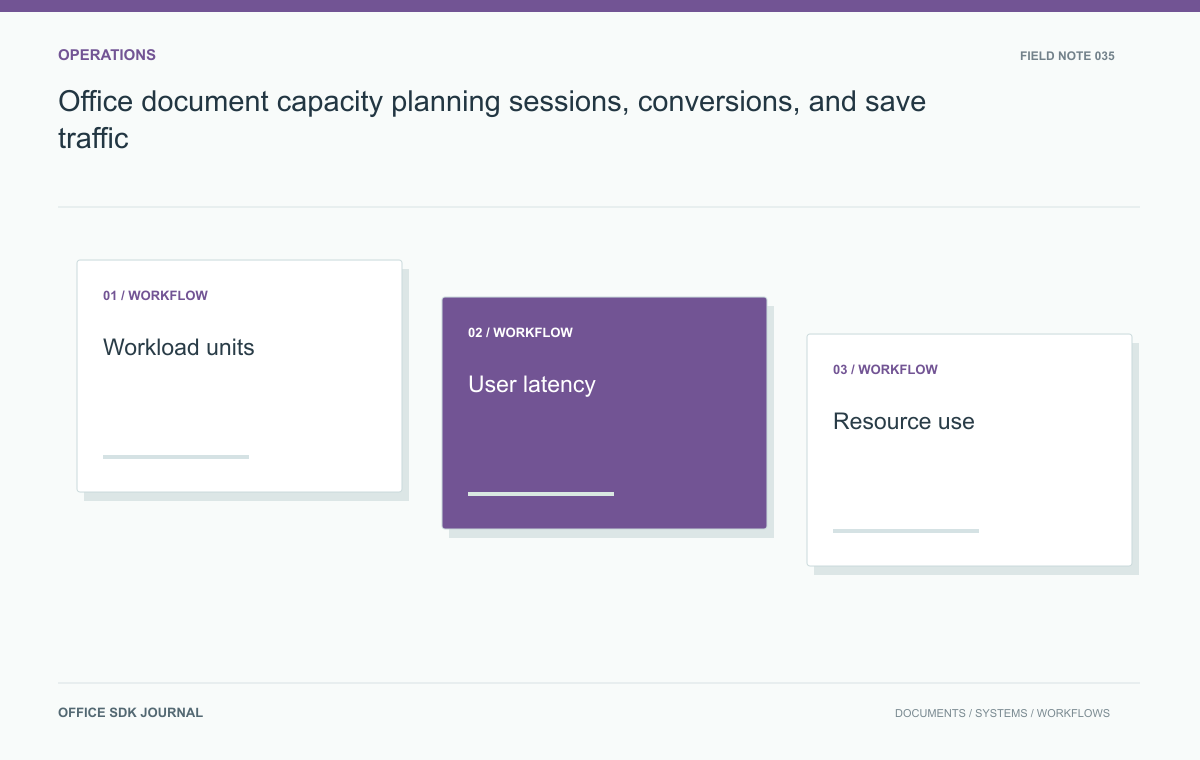
Model capacity with the work the platform performs, not only the number of users. Idle sessions, first-time conversions, large workbook edits, and save bursts stress different components. Measure latency and correctness alongside queue age and resource use under a stated document mix and concurrency profile.
Choose workload units with clear definitions
Track active editing sessions, open and close rates, source retrieval bytes, conversion arrivals, queued work, save events, and export requests where relevant. Keep concurrency distinct from requests per second and from licensed limits that may use their own definitions. A tenant with many idle sessions can behave differently from a smaller tenant importing a large folder. Record document format and complexity distributions alongside volume. These dimensions make the workload reproducible and prevent a single user count from concealing the operations that actually constrain the system.
| Workload unit | What it describes | Outcome to watch |
|---|---|---|
| Active sessions | Simultaneous supported collaboration contexts | Interaction and reconnect behavior |
| New opens per interval | Initialization and source-retrieval demand | Time to useful display |
| Conversion arrivals | Fresh preview or export processing | Queue age and completion time |
| Save events | Persistence and publication demand | Durable version convergence |
Keep these operational units separate from contractual licensing terms. A license may count something called a session or request differently from your dashboard. Use the documented commercial definition for entitlement and the measured system definition for engineering, and explain the relationship instead of substituting one for the other.
When reporting results, include the file mix, cold or warm cache state, client profile, infrastructure, concurrency, and observation window. A number without those conditions cannot be reproduced. Report failures and rejected work as well as completed operations; admission control may protect latency precisely by declining excess demand.

Measure user outcomes alongside infrastructure
Observe latency, failure rate, and queue age together with CPU, memory, storage throughput, network traffic, and database behavior. High utilization is not automatically a problem if outcomes remain within requirements, while low average utilization can hide a saturated single worker or a long tail of slow documents. Break down opening into retrieval, initialization, and useful display where possible. Report percentile or distribution information with sample size and conditions rather than only an average. Include failed operations so the fastest successful subset does not define the reported result.
Build a representative load profile
Model normal activity, expected peaks, batch imports, and recovery after a temporary outage. Use representative synthetic or authorized documents with the complexity seen in production. Separate cold and warm cache behavior. Increase demand gradually while watching downstream dependencies, and stop according to agreed safety limits in the test environment. Do not extrapolate linearly across a bottleneck without evidence. More workers may shift pressure to object storage, databases, network links, or a shared conversion dependency instead of increasing useful throughput in the same proportion.
Compare cached reading with new workbook processing
Run one scenario with many users reading already prepared previews and another with fewer users opening new complex workbooks while a batch import runs. Keep the environment fixed and record open latency, queue age, save completion, and resource use. The purpose is to identify different limiting stages, not to produce a universal benchmark. If the second scenario overloads conversion, test admission limits or scheduling before assuming every component needs more replicas. Document the resulting operating envelope with the exact workload mix that produced it.

Acceptance and reporting conditions
- Define target outcomes for opening, editing, saving, and exporting.
- Track workload units separately from licensing terminology.
- Identify the first saturated dependency under each representative peak.
- Reserve capacity for retries, failover, and maintenance where required.
- Repeat affected scenarios after changing document limits or infrastructure.
Let the bottleneck determine the next experiment
Use the bottleneck to choose the next experiment. If queue age rises while converters remain busy, test scheduling, admitted load, or converter capacity within downstream limits. If workers wait for object storage, adding more workers may only multiply waiting connections. If browsers run out of memory on one workbook pattern, a backend replica change may not address the user-visible problem.
Reserve a scenario for recovery: restart a worker or briefly interrupt a dependency, then watch retry demand and backlog drain. Normal steady-state headroom is not the same as recovery capacity. Record how long the service takes to return to its agreed operating range and whether current users remain able to save during that period.
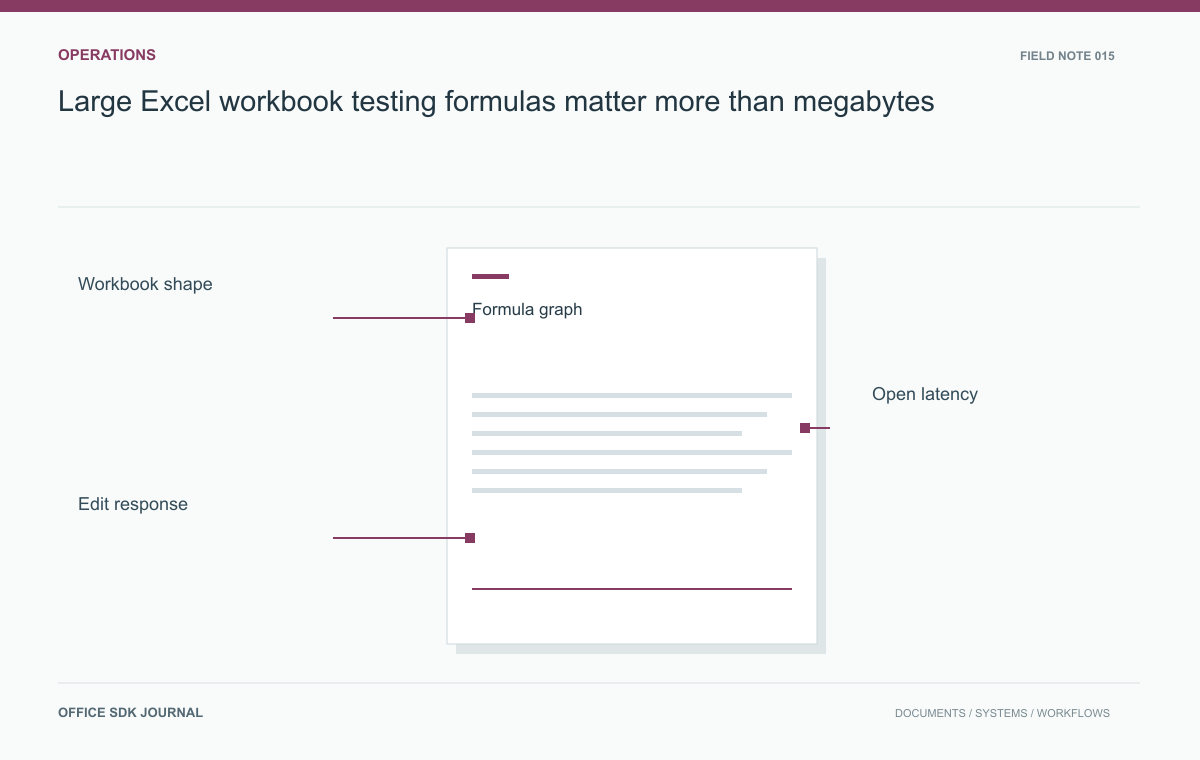
Large Excel workbook testing: formulas matter more than megabytes
Build a workbook acceptance matrix that covers formulas, formatting, charts, and user tasks alongside byte size.
Read story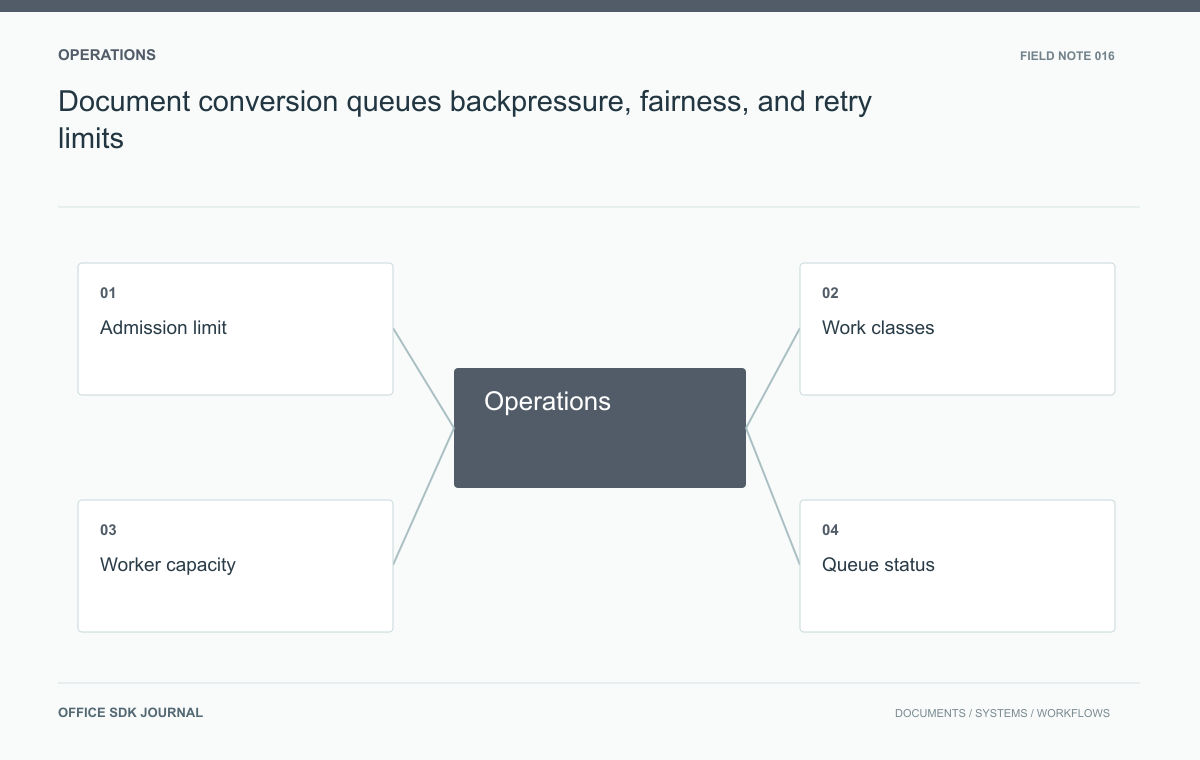
Document conversion queues: backpressure, fairness, and retry limits
Use admission limits, fair scheduling, and visible queue states to preserve predictable conversion behavior under bursts.
Read story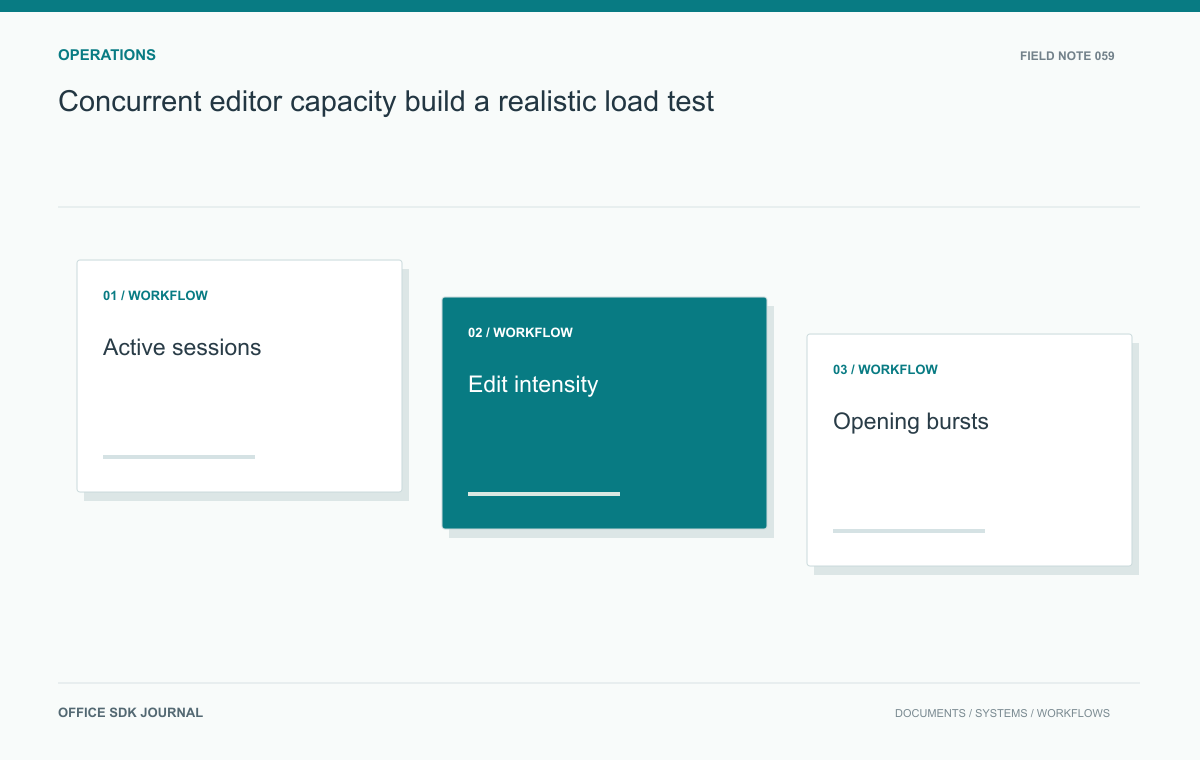
Concurrent editor capacity: build a realistic load test
Plan capacity from active sessions, document behavior, opening bursts, conversion jobs, and degraded operation.
Read story